


Dashboard Tools for Excel
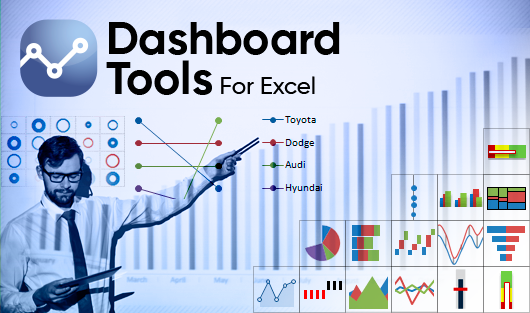
What is Dashboard Tools for Excel ?
Dashboard Tools for Excel is an add-in software for Microsoft® Excel® which helps you to understand complex relationships in your Excel models. With Dashboard Tools for Excel you can use Sparklines, Heatmaps, Minicharts, Bump charts and Special charts, getting dramatically improved data visualization for fast and effective parallel comparisons.
Intuitive Interface - New Ribbon
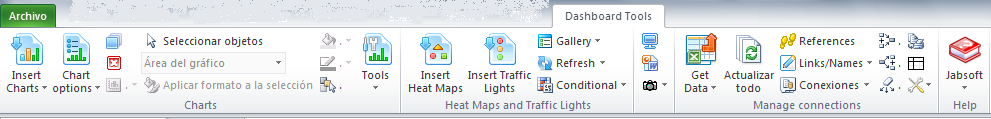
Dashboard Tools for Excel has been created based on Excel native graphics, they can be personalized using all the styles and formats that Excel offers to enrich its presentation.
As it´s been constructed over Excel´s own graphics, it is not necessary to install fonts or any additional requirements to be able to visualize the graphics and distribute them so you won´t have the disadvantage of waiting for the graphics to recalculate whenever the data is modified.
You have six options for graphics. First; you have the possibility of adding resized Sparklines to the size of a cell in order to make a fast analysis of your data. Second; use Traffic Lights to get an visual and fast alarm about the status in a cell, Third; you can insert Heatmaps and icons in order to analyze your data up to 5 dimensions, Fourth; also you have Minicharts that are optimized size graphics which allow a suitable representation of greater amounts of data for dashboards, Fifth; see changes in your data immediately with Bump charts, Sixth; also you will have other Special charts available to enhance the visualization of your reports.
| Sparklines |  |
|
| Minicharts |  |
|
| Traffic Lights |  |
|
| Heatmaps |  |
 |
| Bump charts |  |
 |
| Special Charts |  |
|
| Audit Tools |  |
|
Dashboard Tools for Excel is TOTALLY COMPATIBLE WITH EXCEL 2019 and MICROSOFT WINDOWS 10 (32 or 64 bits) !!
Benefits
- Quick visualization and analysis of complex reports thanks to the charts: Sparklines, Bump charts, icons, and Minicharts.
- When using native Excel functions, it does not require installation of additional fonts or tools to share your reports.
- How you can insert Heatmaps and Traffic Lights.
A Heatmap is a graphical representation of data where the values taken by a variable, in a two-dimensional (or more) map, are represented as colors, size, background, etc.
Traffic Lights is a sort of Heatmap but more specific to get a visual and fast alarm about the status in a cell. - 12 special chart types available, which are not included in Excel, to expand the range of possibilities for data visualization.
- Analyze your models with the Audit Panel quickly and easily.
- With only a few clicks manage names and links of your models using these tools: Link Manager y Names Manager.
- Import SQL data to your Excel spreadsheet without the need to have knowledge about programming.
- Take advantage of the power about Dashboard Tools for Excel' integration with access to Excel data, creating fully updateable reports from the website (watch video).
- You could also generate a report with external data sheet. This sheet can be in the same workbook, in another book, in a database or in a web page.
- Thanks to its internal structure and encoding Dashboard Tools for Excel allows you to categorize databases in Excel or large pieces of data using dynamic tables.
- Full integration with our next service XYNCHRO (Full synchronization among Microsoft Office applications and web connectivity)
- Continuous Update.
- Right to 1 year of updates.
COMPARISON WITH MICROCHARTS
| Spreadsheets Dashboard Tools | MicroCharts | |
| Has its own graphics making for an easy customization Works with Excel personalization options. Because it has been created based on Excel native graphics. |
|
|
| Doesn´t need to install fonts It is not necessary to install fonts or any additional requirements to be able to visualize the graphics and distribute them. |
|
|
| Works much faster You won´t have the disadvantage of waiting for the graphics to recalculate their scales whenever the data is modified. |
|
|
| Excellent level of portability As it´s been constructed over Excel´s own graphics you do not need to worry about additional fonts or details to show the results. |
|
|
| 6 types of graphics: Sparklines, Traffic Lights, Icons & Heatmaps, Minicharts, Bump charts and Special charts. |
|
|
What's New?
In this new version of Dashboard Tools for Excel we have added:
- Totally compatible with Windows 10 and Excel 2019
See history of previous versions here.
Who need this Software
Any type of user that uses Microsoft Excel for his/her projects. It can be used by:
- Financial analysts
- Engineers
- Biologists
- Mathematicians
- Economists
- Teachers
- Students in general
- Scientists
- Any person who uses Excel in the decision making process and wishes to explore his model’s possibilities.
Requirements
- Microsoft Windows Vista, Windows 7, Windows 8 and 10 (32 and 64 bits)
- Microsoft Excel 2007 to 2019 (32 and 64 bits)
- No Mac Compatible
Warranty
Try Before You Buy, You can download a free Trial version to see if it suits your needs.
WARNING:
Buy at your own risk because then you will not be entitled to refund.
Safe Shopping
Click on icons for security info:
![]()
![]()
PRODUCTS
Bundles