
Create Sensitivity Tables
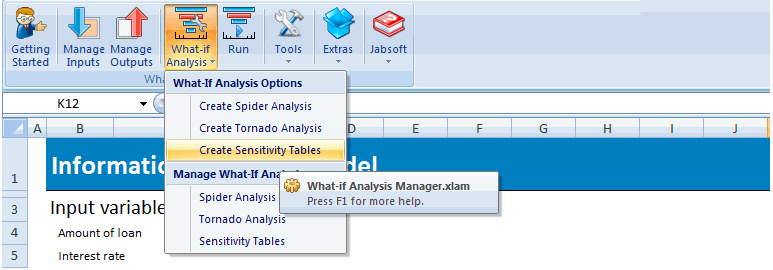
With this tool, you can change inputs at a constant change rate; change rate may different for each input. Then you combine all these changes in all inputs and show the result in the output. This is most convenient when you seek a combination of input values causing a desired impact on the output variable.
First, you have to choose the inputs and outputs as in the following images, as many as 10 inputs and 10 outputs.
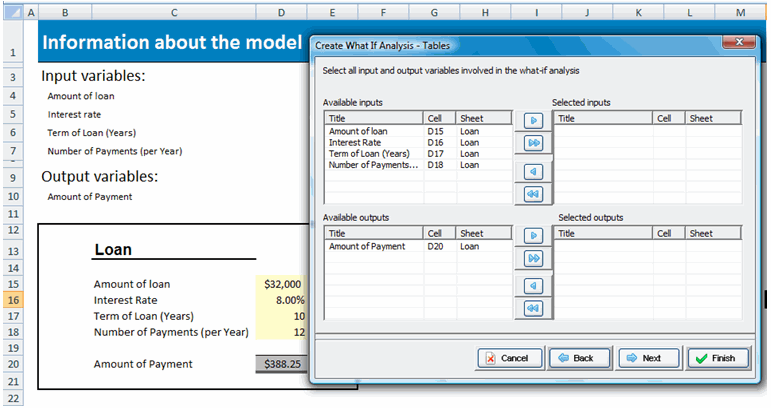
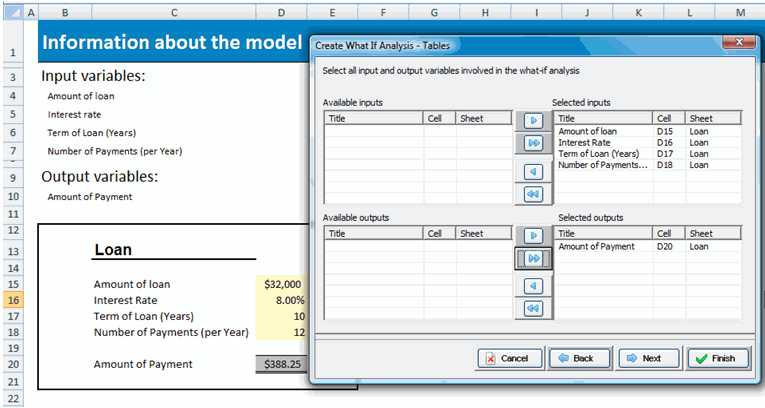
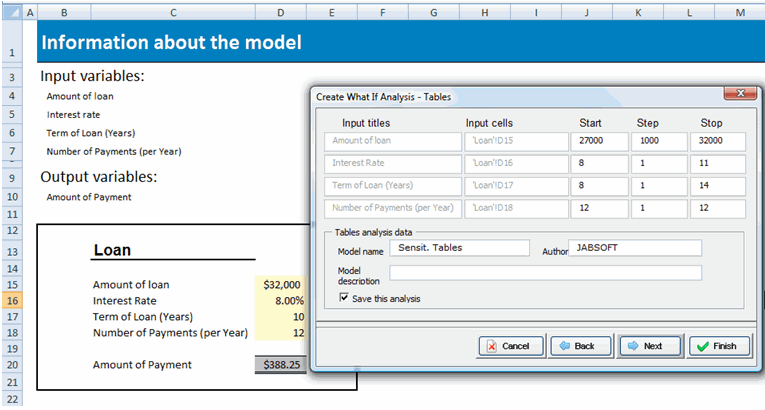
Now click Next. A dialog will pop up where you can enter the change rate values for each input variable.
Alternatively, you can save this data analysis to run it directly later with Run What-If Analysis.
You can edit a saved model with Manage Sensitivity Tables.
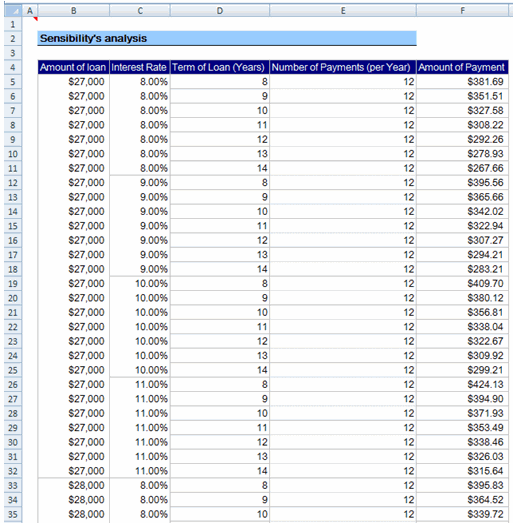
You can see the result in the following image.
As you can see, changes in the outputs are shown after input changes are made;
with this information, you can find the set of values most adequate for your decision making.
