 |
| Create Spider Analysis |
 |
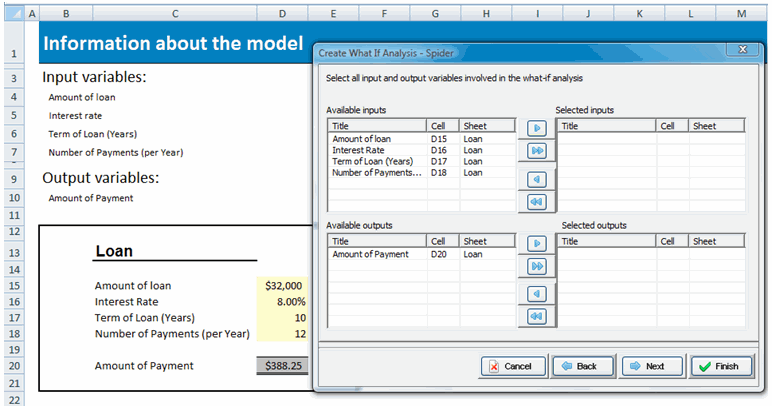
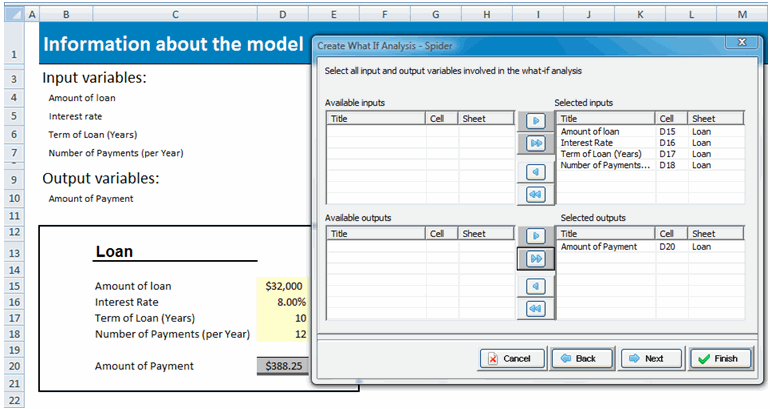
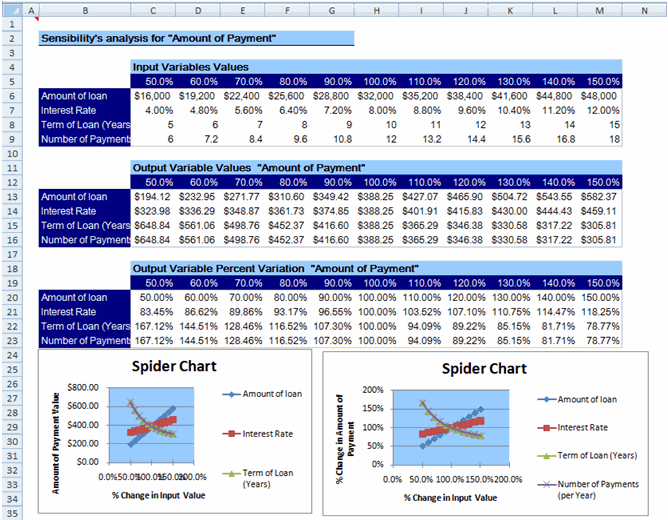
| You can use this function to apply the same percent variation to all selected inputs from a base percentage value, an increase and top value. It shows the impact of these percent changes on the selected output. In addition, it shows a spider chart, where you can see how the output variable changes with changes in the input variable and know if they change in the same or opposite direction. You should first choose the input and output variables. You can select as many as 20 inputs and 1 output for each run. |
 |
 |
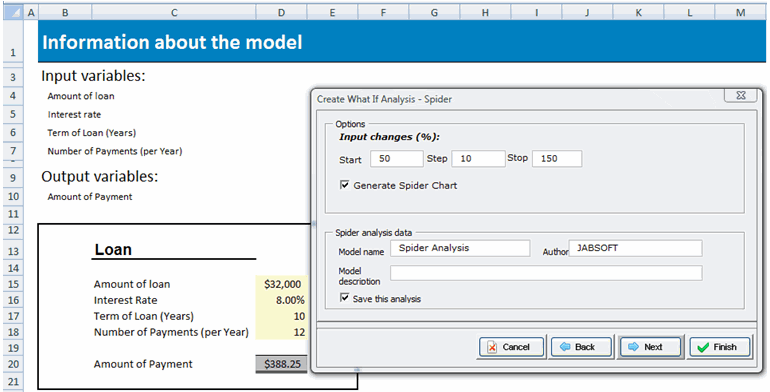
| Then you should enter the initial, change, and final percent values for all input variables. Alternatively, you can save this spider analysis and rerun it from Run What-If Analysis. You can edit a saved model with Manage Spider Analysis. |
 |
| The result is shown below. |
 |