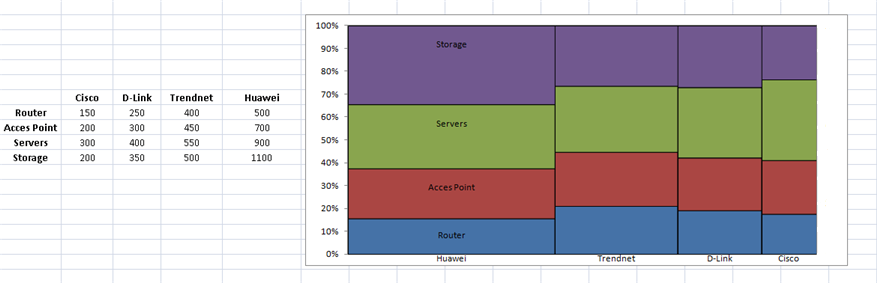
| Marimekko Chart |
 |
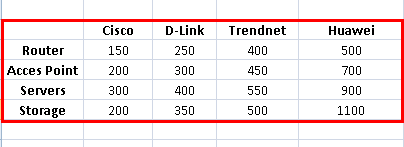
| With this Excel chart you can compare the evolution of sales or the criteria you wish in periods. |
When creating this type of Excel graphic, a hidden sheet (TEST.CHART - the sheet will be automatically created.) will be created with the corresponding data. |
| This kind of Excel graphic does not allow to display changes from the Excel graphic data directly, it will be necessary to create a new Excel graphic to show modifications in the data. |
 |
| In order to generate this type of Excel graphic is necessary to create a hidden sheet to format the data which will allow to show grouped series. The sheet TEST.CHART . is created, which will make reference to the graphic data. |
 |
|
|
| In this type of Excel graphic modifications on the data are done to be abe to build the Excel chart and the floating tags from Excel can show different values. |