| Dot Plot Chart |
 |
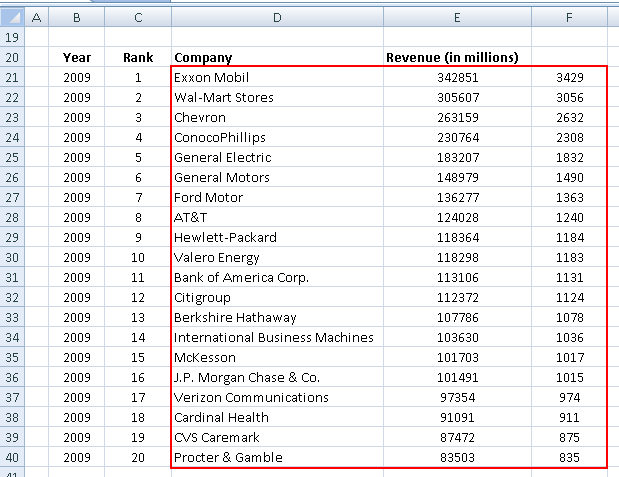
| A dot plot is a statistical Excel chart consisting of group of data points plotted on a simple scale. |
| For this type of Excel graphic the data must have the following structure. |
 |
|
| Dot Plot Chart |
|
| A dot plot is a statistical Excel chart consisting of group of data points plotted on a simple scale. |
| For this type of Excel graphic the data must have the following structure. |
|
|
