| Dot Chart |
 |
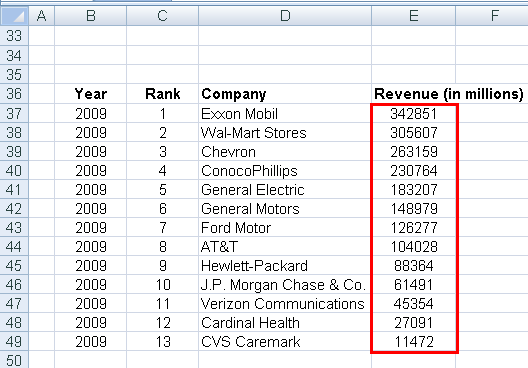
| Using this graphic to represent and compare grouped data in columns. To create a Excel chart of type DOT, simply follow these steps: |
| 1 .- Choose the Excel graphic of type Dot. 2 .- Select the data you want to represent (only numeric values). |
 |
| 3 .- Finally, choose the location where you want to insert the Excel chart. |
 |
|
|