| Cube with percentage |
 |
|
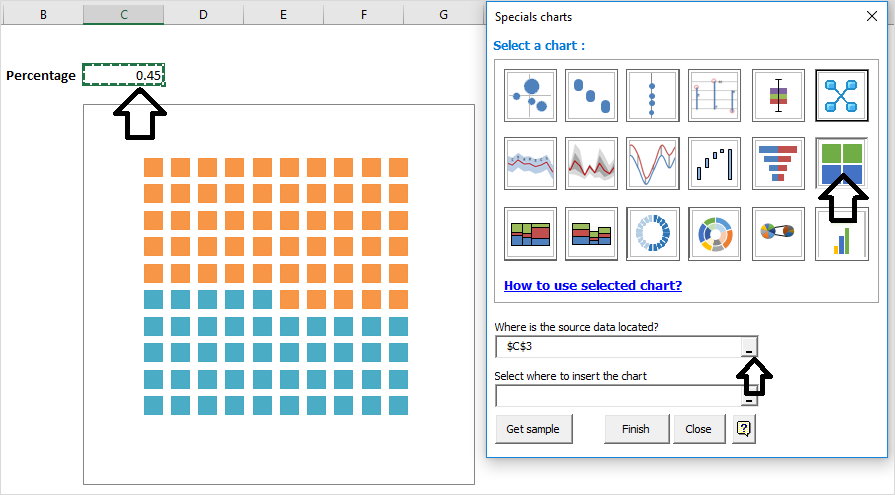
With this graph you can express the percentage of participation of a variable with a single value without exceeding 1 (100%). In this way you can observe the data correctly represented. Example 0.72, 0.4, 71% 1-Activate the sheet with the data and select the cell with the percentage Open the graphics gallery dialog and choose the source data and the graphic type cube with 2-Select where to paste the graph (the data to be plotted must be on the same sheet where you want to paste the graph and in the decimal format> 1..0.75) Finally press the OK button to insert the table. |
You must select the data as it is shown in the example. |
 |